Image Details
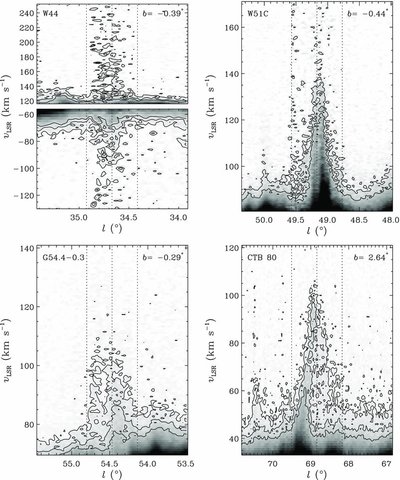
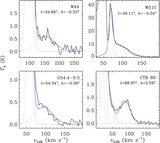
Caption: Figure 2.
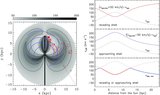
I-GALFA (ℓ, v) maps of H i emission of four SNRs. Each longitude–velocity map is at the latitude given in its upper-right corner. The central longitude of the SNR is marked by the middle dotted line in each panel. The other two dotted lines indicate the boundary of the SNR. The gray scale varies from 0 to 5 K (white to black). Contours are 0.5 and 1.0 K for W51C and 0.3, 0.6, and 1.0 K for the other SNRs.
Other Images in This Article
Copyright and Terms & Conditions
© 2013. The American Astronomical Society. All rights reserved.
Copyright ©
2025 Astronomy Image Explorer. All Rights Reserved.