Image Details
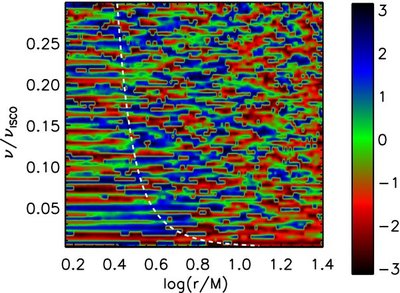
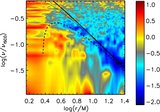
Caption: Figure 9.
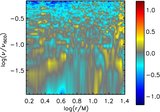
Left: phase ψ(ν,
r) of
dF/
dr fluctuations when seen face-on (
![]() = 5°) for
= 5°) for
 . Note that we deviate from prior figure layouts and use a linear frequency scale here in order to resolve small-scale features.
In addition, we show only the lower half of our frequency range. The dashed curve is the local inflow rate ν
inflow. Right: the linear, periodic color map used to generate this figure.
. Note that we deviate from prior figure layouts and use a linear frequency scale here in order to resolve small-scale features.
In addition, we show only the lower half of our frequency range. The dashed curve is the local inflow rate ν
inflow. Right: the linear, periodic color map used to generate this figure.
Other Images in This Article
Copyright and Terms & Conditions
© 2009. The American Astronomical Society. All rights reserved.
Copyright ©
2025 Astronomy Image Explorer. All Rights Reserved.