Image Details
Caption: Figure 10.
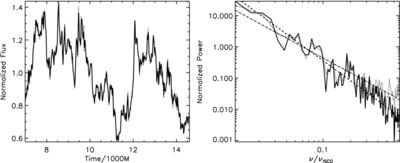
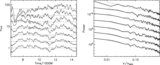
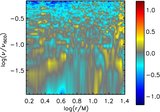
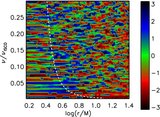
Left: normalized light curves obtained from the calculation ignoring time delay effects (dotted curve) and taking them into
account (solid curve). Right: normalized power spectra of these light curves compared to their best power-law fits; the dashed
line represents the best fit to the data with time delay effects, the dash-dot to the data in which time delays were ignored.
Both light curves are for
![]() = 29° and
= 29° and
 .
.
Other Images in This Article
Copyright and Terms & Conditions
© 2009. The American Astronomical Society. All rights reserved.
Copyright ©
2025 Astronomy Image Explorer. All Rights Reserved.