Image Details
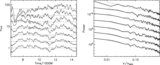
Caption: Figure 6.
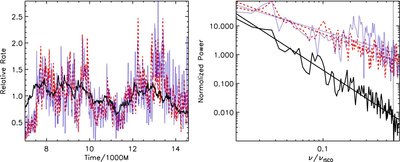
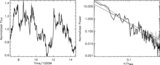
Left: total flux
F(
t) observed at
![]() = 5° for
= 5° for
 (solid black curve) compared to the accretion rate
 (dotted blue curve) at
r = 3.5
M and emissivity
(dotted blue curve) at
r = 3.5
M and emissivity
 at
r = 3.5
M (dashed red curve). All rates are normalized to their time averages. Right: power spectra of these rates and their best-fit
power laws. The values of the best-fit power-law exponents are
at
r = 3.5
M (dashed red curve). All rates are normalized to their time averages. Right: power spectra of these rates and their best-fit
power laws. The values of the best-fit power-law exponents are
 ,
,
 , and α
F
= −2.1.
, and α
F
= −2.1.
Other Images in This Article
Copyright and Terms & Conditions
© 2009. The American Astronomical Society. All rights reserved.