Image Details
Caption: Figure 5.
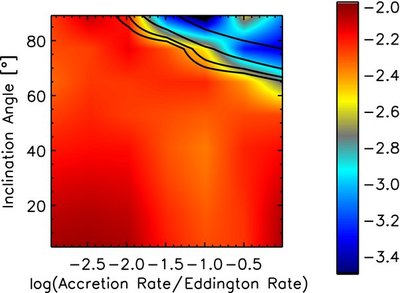
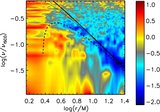
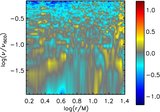
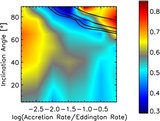
Exponents α of the best power-law fits to the power spectra of the light curves as functions of
 (horizontal axis) and inclination angle (vertical axis). The departures from α ≈ −2 in the upper-right-hand corner of the
plot are caused by the disk's self-obscuration. The black curves represent contours of
R
o
. From bottom to top,
(horizontal axis) and inclination angle (vertical axis). The departures from α ≈ −2 in the upper-right-hand corner of the
plot are caused by the disk's self-obscuration. The black curves represent contours of
R
o
. From bottom to top,
 .
.
Other Images in This Article
Copyright and Terms & Conditions
© 2009. The American Astronomical Society. All rights reserved.
Copyright ©
2025 Astronomy Image Explorer. All Rights Reserved.