Image Details
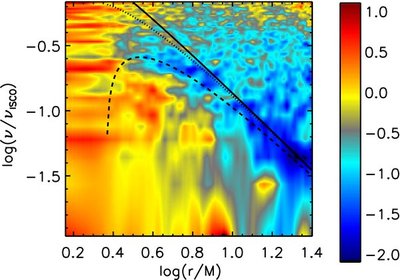
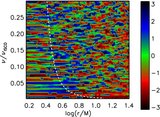
Caption: Figure 7.
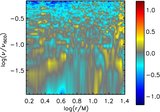
Ratio of the emissivity's normalized power spectrum to the accretion rate's normalized power spectrum plotted as a function of radius and frequency. Each power spectrum was smoothed over nine frequency bins before the ratio was taken in order to display trends in the data more clearly. Black curves show the orbital frequency (solid curve), radial epicyclic frequency (dashed curve), and vertical epicyclic frequency (dotted curve).
Other Images in This Article
Copyright and Terms & Conditions
© 2009. The American Astronomical Society. All rights reserved.
Copyright ©
2025 Astronomy Image Explorer. All Rights Reserved.