Image Details
Caption: Figure 4.
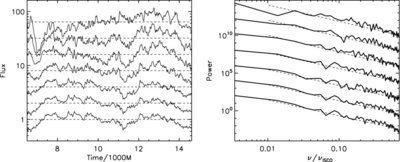
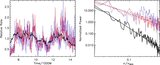
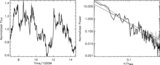
Left: normalized light curves (solid curves) for
![]() = 29° and all values of
= 29° and all values of
 . The light curves and their mean values (dashed curves) have been shifted vertically by incremental factors of two for clarity.
Right: normalized power spectra of these light curves compared to their best power-law fits (dashed curves). The power spectra
are separated by incremental factors of 100. In both plots, the curves are ordered bottom to top in increasing order of
. The light curves and their mean values (dashed curves) have been shifted vertically by incremental factors of two for clarity.
Right: normalized power spectra of these light curves compared to their best power-law fits (dashed curves). The power spectra
are separated by incremental factors of 100. In both plots, the curves are ordered bottom to top in increasing order of
 .
.
Other Images in This Article
Copyright and Terms & Conditions
© 2009. The American Astronomical Society. All rights reserved.
Copyright ©
2025 Astronomy Image Explorer. All Rights Reserved.