Image Details
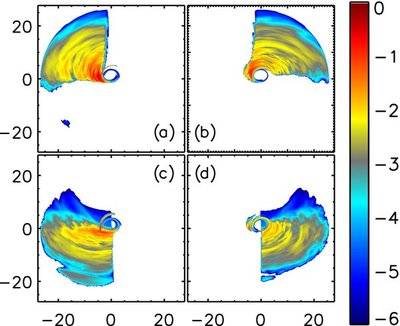
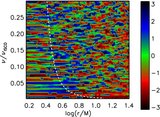
Caption: Figure 1.
(a–d) Snapshots at, respectively,
![]() = {π, π/2, 3π/2, 0}. Each image was taken at
= {π, π/2, 3π/2, 0}. Each image was taken at
![]() = 53° and
t = 9000
M with
= 53° and
t = 9000
M with
 . The axes mark the image's vertical and horizontal extent in the image plane in units of
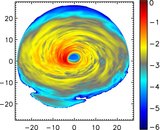
M. Far right: logarithmic color map used to make the images. The intensity is normalized to the maximum intensity of the composite
image shown in Figure
2.
. The axes mark the image's vertical and horizontal extent in the image plane in units of
M. Far right: logarithmic color map used to make the images. The intensity is normalized to the maximum intensity of the composite
image shown in Figure
2.
Other Images in This Article
Copyright and Terms & Conditions
© 2009. The American Astronomical Society. All rights reserved.
Copyright ©
2025 Astronomy Image Explorer. All Rights Reserved.