Image Details
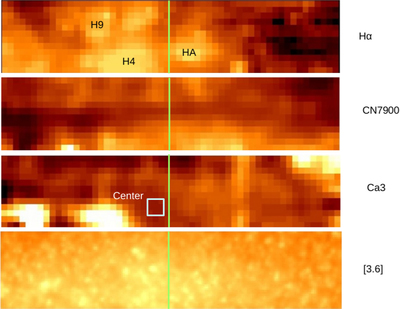
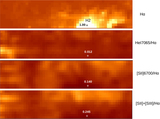
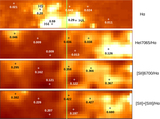
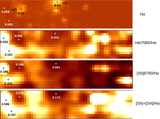
Caption: Figure 9.
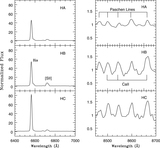
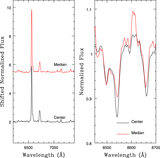
Distribution of Hα (top panel), CN7900 (second panel), and Ca3 (third panel) indices in the spatial interval examined in Figure 5. The indices are displayed with a logarithmic stretch, with darker shades corresponding to deeper features. The bottom panel shows this same area imaged in [3.6]. The minor axis of NGC 55 is indicated with a green line. The distribution of CN7900 and Ca3 indices shows structure that tends to be anticorrelated with Hα, in the sense that weak Ca3 absorption is found in areas with strong Hα emission. Still, there are exceptions. An area with deep Ca3 absorption is seen to the right of H4 near the minor axis of NGC 55, and this corresponds to a concentration of luminous sources in the [3.6] image. Other areas with deeper than average Ca absorption are also seen above and to the left of H4. It is evident from the [3.6] image that the stellar content in this part of NGC 55 is not uniformly mixed, and that there is a population of luminous evolved stars close to the center of NGC 55. The blue square indicates the area where the Center spectrum plotted in Figure 10 was extracted.
Other Images in This Article
Show More
Copyright and Terms & Conditions
© 2019. The American Astronomical Society. All rights reserved.