Image Details
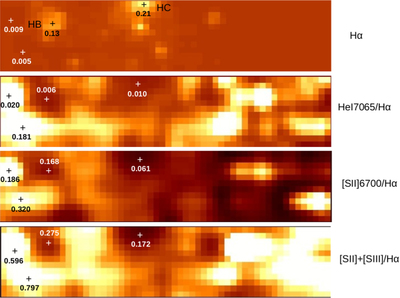
Caption: Figure 6.
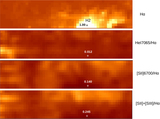
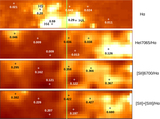
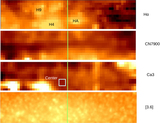
Same as Figure 4, but for the right third of the area observed with GMOS in Figure 1. Localized areas of star formation dominate the Hα map, and HB and HC are star-forming regions that are discussed in the text. The surface brightness in this part of NGC 55 at visible/red wavelengths is lower on average than in the areas displayed in Figures 4 and 5. Line measurements that depart markedly from those that are more typical throughout the area observed with GMOS tend to occur where low signal levels affect line strength measurements.
Other Images in This Article
Show More
Copyright and Terms & Conditions
© 2019. The American Astronomical Society. All rights reserved.
Copyright ©
2025 Astronomy Image Explorer. All Rights Reserved.