Image Details
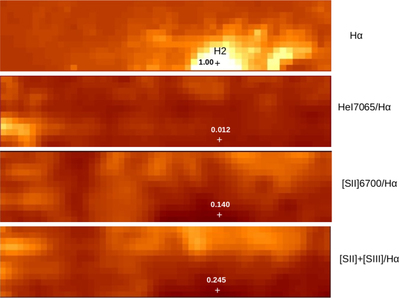
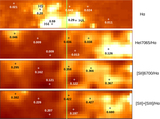
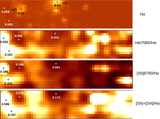
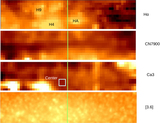
Caption: Figure 4.
Spatial distribution of Hα line strengths (top panel), and the relative strengths of three emission lines with respect to Hα (lower three panels). The angular interval examined in this figure is the left third of the GMOS field shown in Figure 1. The numbers in the top panel show the relative strength of Hα emission normalized to that of H2. The numbers in the other panels show relative line strengths with respect to Hα. [S II]+[S III] is the sum of the [S II] 6717+6731 Å doublet and the [S III]9069 line strengths. Hα measurements are displayed with a logarithmic stretch while line ratios are shown with a linear stretch. The star-forming complex identified as H2 in Figure 2 of Otte & Dettmar (1999) is marked.
Other Images in This Article
Show More
Copyright and Terms & Conditions
© 2019. The American Astronomical Society. All rights reserved.