Image Details
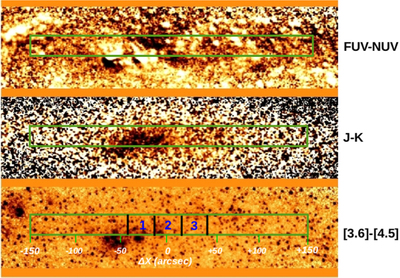
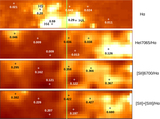
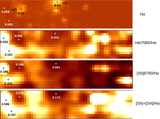
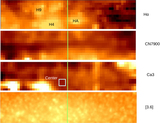
Caption: Figure 2.
FUV – NUV (top panel), J − K (middle panel), and [3.6] – [4.5] (bottom panel) colors near the center of NGC 55. The green box in each panel marks the area observed with GMOS. Areas with the bluest colors are shown in white, while the darkest areas have the reddest colors. The three angular intervals used to construct the spectra shown in Figure 3 are marked in the bottom panel, along with offsets from the minor axis (ΔX). The complex distribution of the light near the center of NGC 55 is evident in the broadband colors. Concentrated pockets of recent star-forming activity with blue FUV – NUV colors due to early-type stars, and red colors in J − K and [3.6] – [4.5] due to thermal and continuum emission, are obvious to the left of the minor axis. The area to the right of the minor axis samples a part of the galaxy that has been less active in terms of recent star formation, although pockets of hot blue stars are still present, and these are seen in the GMOS spectra (Section 4).
Other Images in This Article
Show More
Copyright and Terms & Conditions
© 2019. The American Astronomical Society. All rights reserved.