Image Details
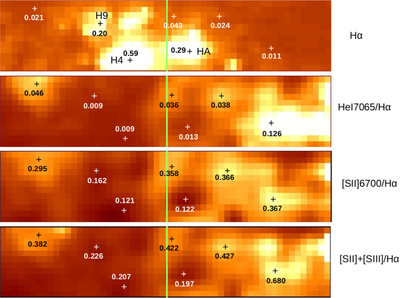
Caption: Figure 5.
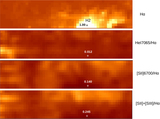
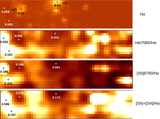
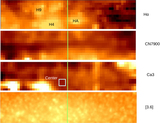
Same as Figure 4, but for the middle third of the area observed with GMOS. The surface brightness at visible/red wavelengths is highest in this area. The minor axis of NGC 55 is indicated by the green line. The star-forming complex H4 (Figure 2 of Otte & Dettmar 1999) dominates the Hα distribution, although smaller Hα-emitting areas are also present. There is a tendency for He I 7065/Hα, [S II]6717+6731/Hα, and [S II]+[S III]/Hα to peak outside the star-forming regions. The prominent ring-shaped structure in the He I/Hα, [S II]/Hα, and [S II]+[S III]/Hα diagrams immediately to the right of the minor axis and centered on HA is discussed in the text.
Other Images in This Article
Show More
Copyright and Terms & Conditions
© 2019. The American Astronomical Society. All rights reserved.