Image Details
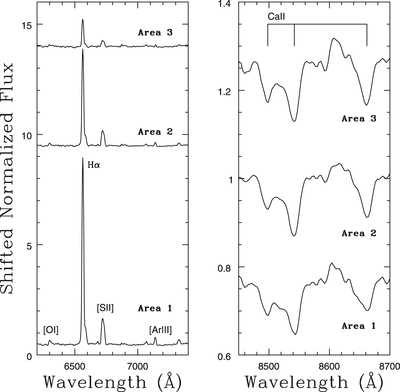
Caption: Figure 3.
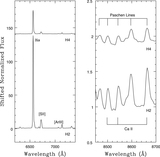
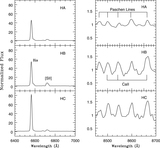
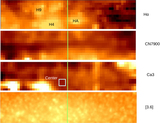
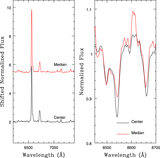
Mean spectra of the three angular intervals centered on the minor axis of NGC 55 that are marked in the lower panel of Figure 2. Wavelengths near Hα and the Ca triplet are shown. The spectra have been normalized to the continuum and shifted along the vertical axis for display purposes. There is a gradient in emission line strengths from Area 1 to Area 3. The strong emission lines in the Area 1 spectrum originate in the H4 star-forming complex. That the variations in the Ca lines are much more subtle than those among the emission lines suggests that veiling by continuum emission near 8600 Å is modest.
Other Images in This Article
Show More
Copyright and Terms & Conditions
© 2019. The American Astronomical Society. All rights reserved.