Image Details
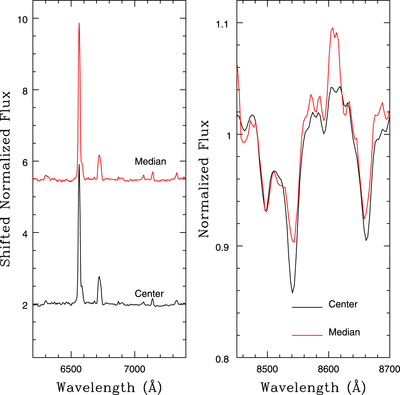
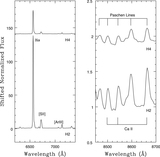
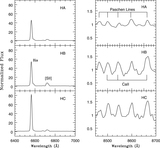
Caption: Figure 10.
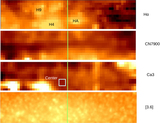
Mean spectrum of the area marked “Center” in Figure 9, and the median spectrum of the entire area sampled with GMOS (“Median”). The spectra have been normalized to the continuum, and those in the left panel have been shifted vertically for display purposes. Hα emission in the Center spectrum is only slightly weaker than that in the Median spectrum. However, the Ca lines in the Center spectrum are much deeper than those in the Median spectrum.
Other Images in This Article
Show More
Copyright and Terms & Conditions
© 2019. The American Astronomical Society. All rights reserved.
Copyright ©
2025 Astronomy Image Explorer. All Rights Reserved.