Image Details
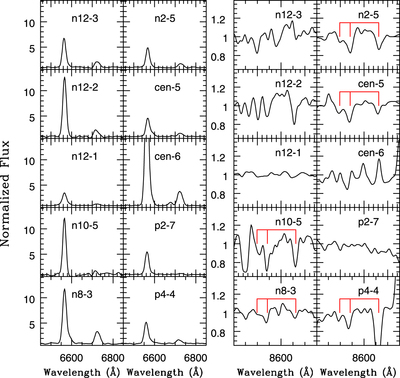
Caption: Figure 13.
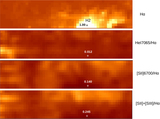
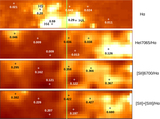
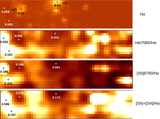
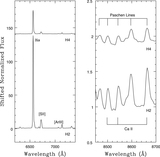
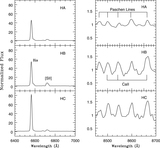
Spectra of compact sources classified as H II regions. Wavelengths near Hα are examined in the left panel, while wavelengths centered on the near-infrared Ca triplet are covered in the right panel. The spectra have been normalized to the continuum. All objects have [S II]/Hα ratios that are consistent with photoionization generated close to the ionizing source(s); none is an SNR. Hα emission is strongest in cen-6, and in many cases the emission lines in the Pa series are clearly seen in the wavelength interval containing the Ca triplet. Still, some of the spectra have prominent Ca triplet absorption, indicating that luminous red stars are concentrated within ∼10 pc of the line-emitting regions. The wavelengths of the Ca triplet lines are marked in those spectra. The abnormally strong Ca line near 8662 Å in the p4-4 spectrum is likely due to poor sky subtraction caused by non-uniformities in the background light.
Other Images in This Article
Show More
Copyright and Terms & Conditions
© 2019. The American Astronomical Society. All rights reserved.