Image Details
Caption: Figure 12.
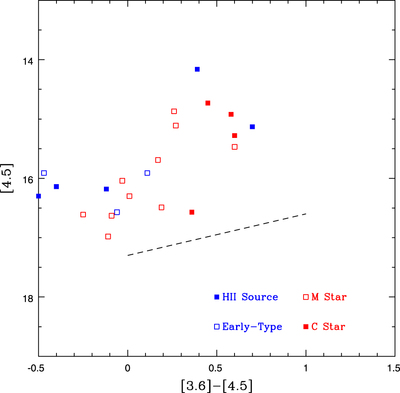
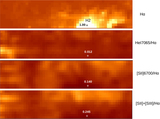
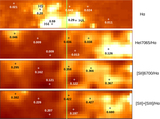
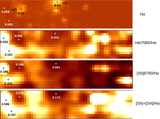
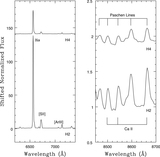
The ([4.5], [3.6] – [4.5]) color–magnitude diagram of point sources in the GMOS observations. The light from each of these objects likely comes from many stars, although a small number of objects may dominate the light output at these wavelengths. The dashed line shows the faint limit of the Spitzer observations. Objects in which the light originates from sources with effective temperatures in excess of a few thousand kelvin have [3.6] – [4.5] ∼ 0. The broad color distribution of sources that are matched with H II regions reflects the diverse SEDs of sources within star-forming areas. The two bright, red sources associated with H II regions are probably highly obscured young clusters.
Other Images in This Article
Show More
Copyright and Terms & Conditions
© 2019. The American Astronomical Society. All rights reserved.