Image Details
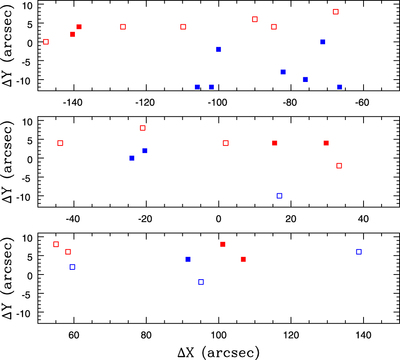
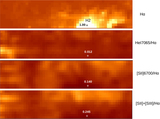
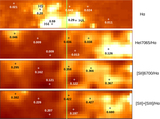
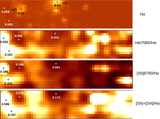
Caption: Figure 11.
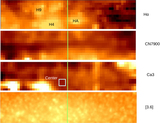
Locations of individual sources, with coordinates measured along the major and minor axes. The intersection of the major and minor axes defines the origin of the coordinate system. The panels cover the same areas as in Figures 4–6, and the coordinates are listed in the second and third columns of Table 3. Sources with spectra classified as M-type (open red squares), C star-type (filled red squares), early-type (open blue squares), and H II region-like (filled blue squares) are shown. The majority of compact H II regions are located near H2 and H4, suggesting that they may be the result of star formation propagating throughout these areas. The remaining sources are distributed more or less uniformly over the northern part of the area observed with GMOS. This is an area where line emission is less intense and obscuration due to dust is lower than in the southern half of the area studied. The image quality in some of the spectra that sample the southern half of the field is also slightly poorer than for those that sample the northern half, although the difference in image quality is small enough so as not to markedly affect the detection of point sources.
Other Images in This Article
Show More
Copyright and Terms & Conditions
© 2019. The American Astronomical Society. All rights reserved.