Image Details
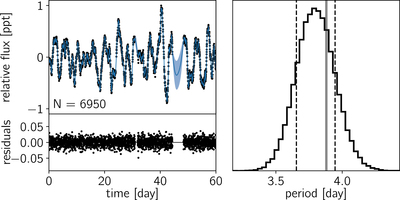
Caption: Figure 7.
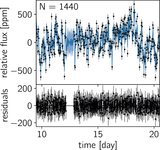
Inferred constraints on a quasi-periodic GP model using the covariance function in Equation (56) and two quarters of Kepler data. Top left: Kepler data (black points) and the MAP model prediction (blue curve) for a 60-day subset of the data used. The solid blue line shows the predictive mean, and the blue contours show the predictive standard deviation. Bottom left: residuals between the mean predictive model and the data shown in the top left figure. Right: posterior constraint on the rotation period of KIC 1430163 using the data set and model from Figure 7. The period is the parameter Prot in Equation (56), and this figure shows the posterior distribution marginalized over all other nuisance parameters in Equation (56). The 1σ error bar on this measurement is indicated with vertical dashed lines. This result is consistent with the published rotation period made using the full Kepler baseline, shown as a vertical gray line (Mathur et al. 2014).
Other Images in This Article
Show More
Copyright and Terms & Conditions
© 2017. The American Astronomical Society. All rights reserved.