Image Details
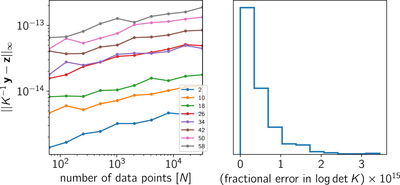
Caption: Figure 2.
Left: maximum numerical error introduced by the algorithm described in the text as a function of the number of celerite terms J and data points N. Each line corresponds to a different J, and the error increases with J as shown in the legend. Each point in this figure is the average result across 10 systems with randomly sampled parameters. Right: distribution of fractional error on the log-determinant of K computed using the algorithm described in the text compared to the algorithm implemented in NumPy (Van Der Walt et al. 2011) for the same systems shown in the left panel. This histogram only includes comparisons for ﹩N\leqslant 2048﹩ because standard methods become computationally expensive for larger systems.
Other Images in This Article
Show More
Copyright and Terms & Conditions
© 2017. The American Astronomical Society. All rights reserved.