Image Details
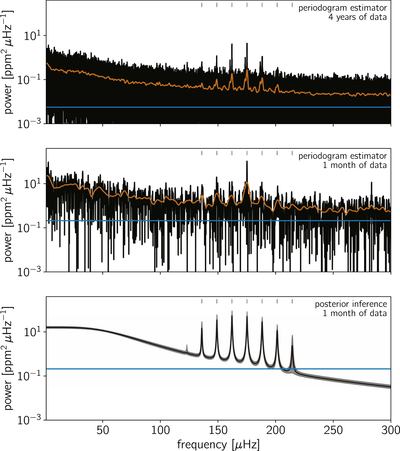
Caption: Figure 10.
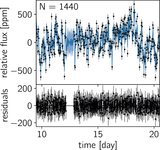
Comparison between the Lomb–Scargle estimator of the PSD and the posterior inference of the PSD as a mixture of stochastically driven simple harmonic oscillators. Top: periodogram of the Kepler light curve for KIC 11615890 computed on the full 4 yr baseline of the mission. The orange line shows a smoothed periodogram, and the blue line indicates the level of the measurement uncertainties. Middle: same periodogram computed using about a month of data. Bottom: power spectrum inferred using the mixture of SHOs model described in the text and only 1 month of Kepler data. The black line shows the median of posterior PSD, and the gray contours show the 68% credible region.
Other Images in This Article
Show More
Copyright and Terms & Conditions
© 2017. The American Astronomical Society. All rights reserved.