Image Details
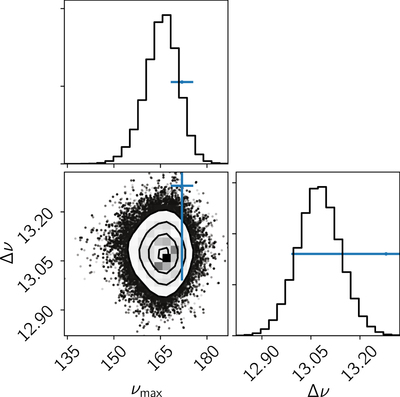
Caption: Figure 9.
Probabilistic constraints on ﹩{\nu }_{\max }﹩ and ﹩{\rm{\Delta }}\nu ﹩ from the inference shown in Figure 8 compared to the published value (blue error bars) based on several years of Kepler observations (Pinsonneault et al. 2014). The two-dimensional contours show the 0.5σ, 1σ, 1.5σ, and 2σ credible regions in the marginalized planes, and the histograms along the diagonal show the marginalized posterior for each parameter.
Other Images in This Article
Show More
Copyright and Terms & Conditions
© 2017. The American Astronomical Society. All rights reserved.
Copyright ©
2025 Astronomy Image Explorer. All Rights Reserved.