Image Details
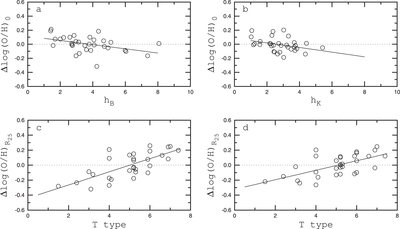
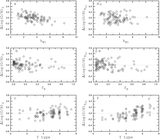
Caption: Figure 19.
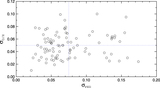
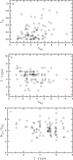
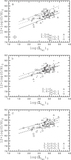
Panel a. The residuals of the OH–SB relation for the B band at the center of the disk as a function of the disk scale length hB. The points indicate the values of the individual galaxies. The solid lines are linear best fits to those data. The dotted lines show zero lines. Panel b. The same as panel a but for the K band. Panel c. The residuals of the OH–SB relation for the B band at the optical edge of the disk as a function of the morphological T type. Panel d. The same as panel c but for the K band.
Other Images in This Article
Show More
Copyright and Terms & Conditions
© 2014. The American Astronomical Society. All rights reserved.
Copyright ©
2025 Astronomy Image Explorer. All Rights Reserved.