Image Details
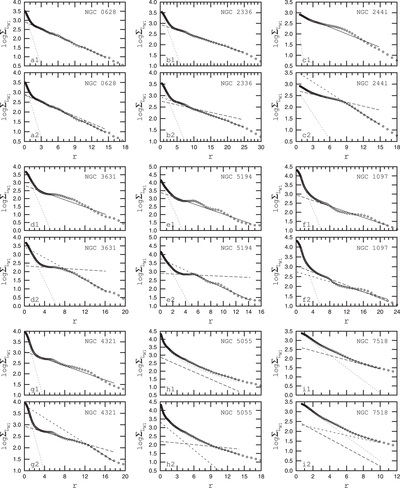
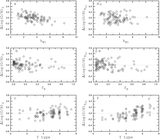
Caption: Figure 1.
Resulting patterns of the bulge-disk decomposition of some of our target galaxies. Each galaxy is presented in two panels. Each upper panel ﹩x1﹩ shows the decomposition assuming a pure exponential for the disk (with “x” running from the letters a to i). The measured surface profile is plotted using circles. The bulge contribution is shown by a dotted line, the disk contribution by a dashed line, and the total (bulge + disk) fit by a solid line. Each lower panel ﹩x2﹩ shows the decomposition assuming a broken exponential for the disk. The bulge contribution is marked by a dotted line, the inner disk by a long-dashed line, the outer disk by a short-dashed line, and the total (bulge + disk) fit by a solid line.
(Supplemental data of this figure are available in the online journal.)
Other Images in This Article
Show More
Copyright and Terms & Conditions
© 2014. The American Astronomical Society. All rights reserved.