Image Details
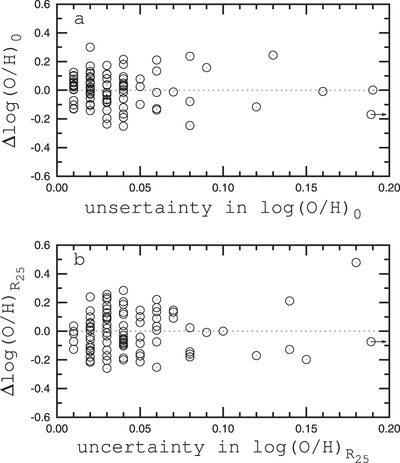
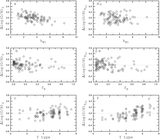
Caption: Figure 8.
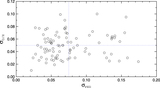
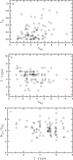
Panel a shows deviations of the central oxygen abundances from the one-dimensional O/H–SB relation (the residuals of Equation (7)) as a function of the uncertainty in central oxygen abundance. Panels b shows deviations of the oxygen abundances at the isophotal R25 radius of a galaxy from the one-dimensional O/H–SB relation (the residuals of Equation (12)) as a function of the uncertainty in the oxygen abundances. The points show the values of the individual galaxies. The dotted lines indicate residuals of zero.
Other Images in This Article
Show More
Copyright and Terms & Conditions
© 2014. The American Astronomical Society. All rights reserved.
Copyright ©
2025 Astronomy Image Explorer. All Rights Reserved.