Image Details

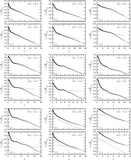
Caption: Figure 6.
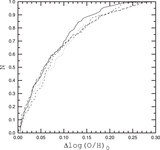
Histograms of morphological T types (panel a), disk scale lengths in the ﹩W1﹩ ﹩WISE﹩ band (panel b), optical radii R25 (panel c), central oxygen abundances 12 + log(O/H)0 (panel d), and radial oxygen abundance gradients (panel e) for our sample of galaxies.
Other Images in This Article
Show More
Copyright and Terms & Conditions
© 2014. The American Astronomical Society. All rights reserved.
Copyright ©
2025 Astronomy Image Explorer. All Rights Reserved.