Image Details
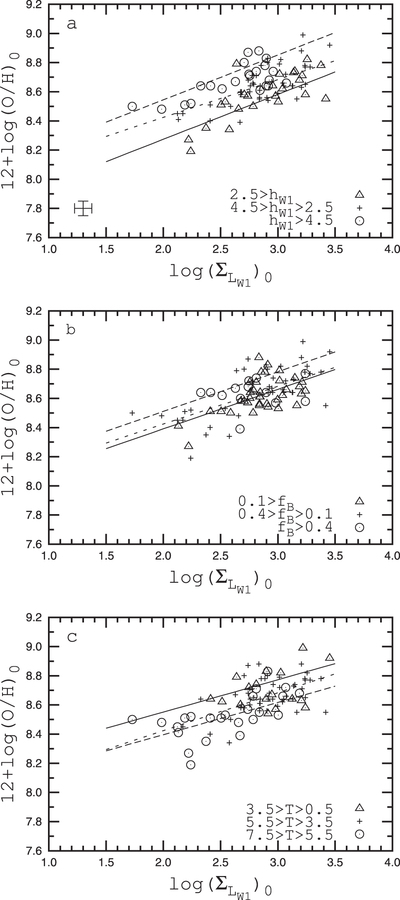
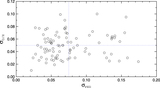
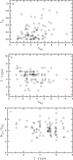
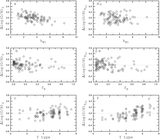
Caption: Figure 7.
Central oxygen abundance as a function of central surface brightness of the disk in the ﹩W1﹩ band. The dotted line in each panel shows the simple relation (Equation (7)). Panel a shows the subdivision of our sample of galaxies into three subsamples according to the value of disk scale length hW1. The solid line corresponds to the parametric relation O/H = ﹩f({{{\rm \Sigma}}_{{{L}_{W1}}}},{{h}_{W1}})﹩ (Equation (8)) for hW1 = 1 kpc. The dashed line is the relation for hW1 = 7 kpc. Typical errors are shown by the cross in the lower left corner. Panel b shows the subdivision of our sample of galaxies into three subsamples according to the value of the bulge contribution fB to the total galaxy luminosity. The solid line corresponds the parametric relation O/H = ﹩f({{{\rm \Sigma}}_{{{L}_{W1}}}},{{f}_{B}})﹩ (Equation (9)) for fB = 0. The dashed line shows the corresponding relation for fB = 1. Panel c shows the subdivision of our sample of galaxies into three subsamples according to the morphological T type. The solid line corresponds to the parametric relation O/H = ﹩f({{{\rm \Sigma}}_{{{L}_{W1}}}},T)﹩ (Equation (10)) for T = 1. The dashed line represents the relation for T = 7.
Other Images in This Article
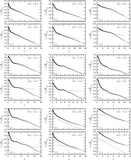
Show More
Copyright and Terms & Conditions
© 2014. The American Astronomical Society. All rights reserved.