Image Details
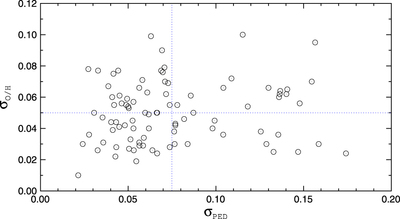
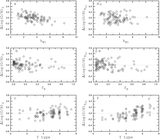
Caption: Figure 4.
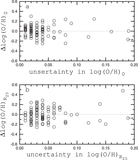
Deviation in oxygen abundances around the radial abundance gradient (in dex) vs. the deviation in surface brightness (Equation (4)) around the surface brightness profile fit assuming a pure exponential for the disk. Dotted lines show the average values of the deviations.
Other Images in This Article
Show More
Copyright and Terms & Conditions
© 2014. The American Astronomical Society. All rights reserved.
Copyright ©
2025 Astronomy Image Explorer. All Rights Reserved.