Image Details
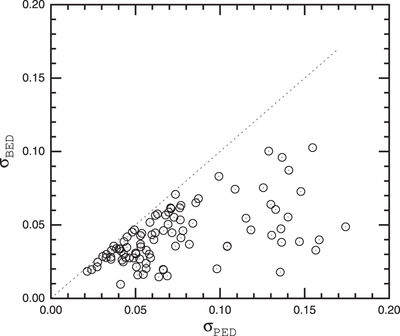
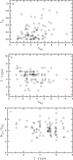
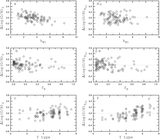
Caption: Figure 2.
Quality of the surface brightness profile fit obtained via the bulge-disk decomposition. The mean deviation ﹩{{\sigma }_{{\rm BED}}}﹩ of the fit assuming a broken exponential disk is plotted vs. the mean deviation ﹩{{\sigma }_{{\rm PED}}}﹩ of the fit assuming a pure exponential disk. The dotted line shows equal values.
Other Images in This Article
Show More
Copyright and Terms & Conditions
© 2014. The American Astronomical Society. All rights reserved.
Copyright ©
2025 Astronomy Image Explorer. All Rights Reserved.