Image Details
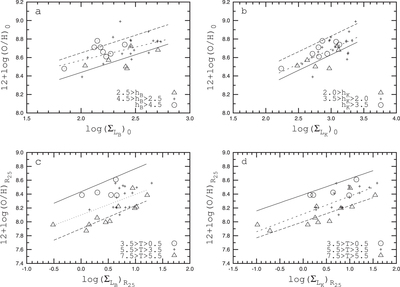
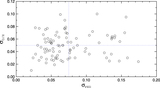
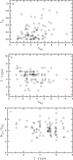
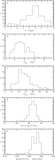
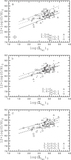
Caption: Figure 18.
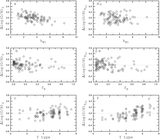
Panels a and b show the central oxygen abundance as a function of central surface brightness of the disk in the B and K bands. Panels c and d show this quantity at the optical edge of a galaxy. The dotted line in each panel shows the one-dimensional relation. Panel a illustrates the division of galaxies into three subsamples according to the value of their disk scale length hB. The solid line corresponds to the parametric relation O/H = ﹩f({{{\rm \Sigma}}_{{{L}_{B}}}},{{h}_{B}})﹩ for hB = 1 kpc while the dashed line represents the parametric relation for hB = 7 kpc. Panel b shows the same as panel a but for the K band. Panel c shows the division of our sample of galaxies into three subsamples according to the morphological T type. The solid line is the parametric relation O/H = ﹩f({{{\rm \Sigma}}_{{{L}_{B}}}},T)﹩ for T = 1, the dashed line is that for T = 7. Panel d shows the same as panel c but for the K band.
Other Images in This Article
Show More
Copyright and Terms & Conditions
© 2014. The American Astronomical Society. All rights reserved.