Image Details
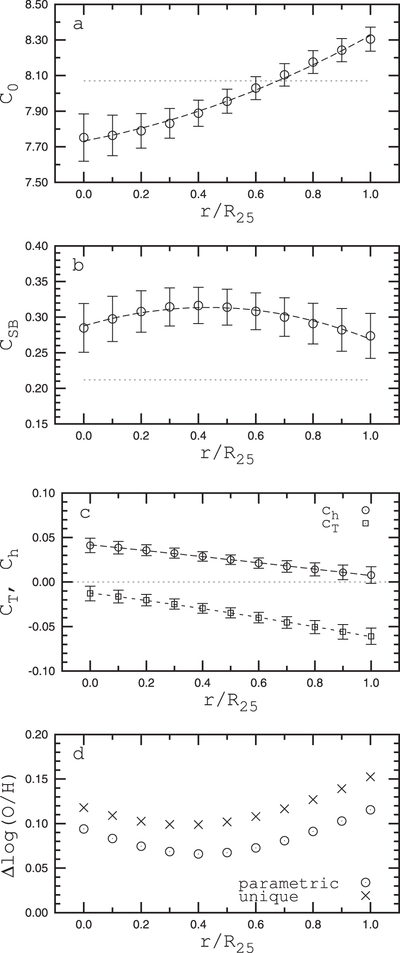
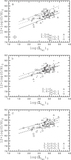
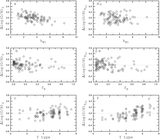
Caption: Figure 14.
Coefficients C0 (panel a), CSB (panel b), Ch (panel c, circles), and CT (panel c, squares) in parametric OH–SB relation as a function of galactocentric distance. The dashed lines are the best fits to the data points. The dotted lines are the corresponding coefficients in the simple OH–SB relation. Panel d shows the deviations around the simple relation, residuals of Equation (18), (crosses) and around the parametric relation, residuals of Equation (19), (circles) as a function of galactocentric distance.
Other Images in This Article
Show More
Copyright and Terms & Conditions
© 2014. The American Astronomical Society. All rights reserved.
Copyright ©
2025 Astronomy Image Explorer. All Rights Reserved.