Image Details
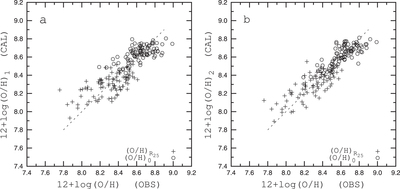
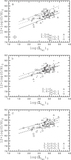
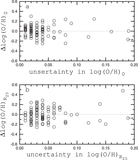
Caption: Figure 11.
Comparison between computed and observed oxygen abundances at the centers of galaxies (circles) and at the optical edge of the galaxies’ R25 isophotal radius (plus signs). Panel a shows the computed oxygen abundances obtained from the one-dimensional relations (Equations (7) and (12)). Panel b shows the computed oxygen abundances obtained from the two-dimensional relations (Equations (8) and (15)).
Other Images in This Article
Show More
Copyright and Terms & Conditions
© 2014. The American Astronomical Society. All rights reserved.
Copyright ©
2025 Astronomy Image Explorer. All Rights Reserved.