Image Details
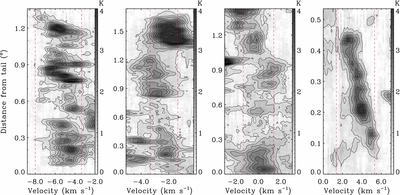
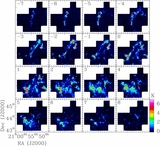
Caption: Figure 17.
13CO position–velocity map of the four filamentary structures along the axes shown in the integrated intensity maps of Figure 16. The lowest contour is 5σ, and the contour interval is 5σ for each panel. Red dashed lines indicate the velocity range of each filament.
Other Images in This Article


Show More
Copyright and Terms & Conditions
© 2014. The American Astronomical Society. All rights reserved.
Copyright ©
2025 Astronomy Image Explorer. All Rights Reserved.