Image Details
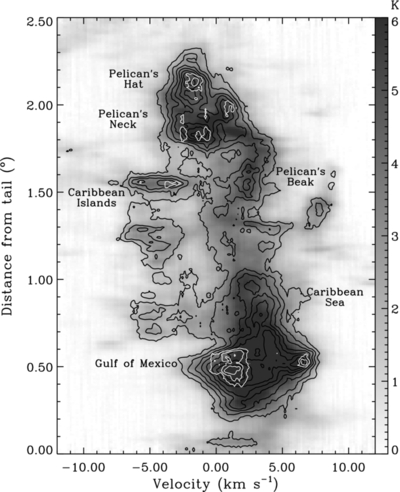
Caption: Figure 8.
Position–velocity map along the axis shown in Figure 7. The spectrum on each position is averaged along a 1° width line perpendicular to the axis. The grayscale background indicates 12CO, black contours indicate 13CO, and white contours indicate C 18O. The lowest contour is 10σ, and the contour interval is 10σ (0.28 K) for 13CO and 5σ (0.1 K) for C 18O. Projected positions of six regions are marked.
Other Images in This Article


Show More
Copyright and Terms & Conditions
© 2014. The American Astronomical Society. All rights reserved.
Copyright ©
2025 Astronomy Image Explorer. All Rights Reserved.