Image Details
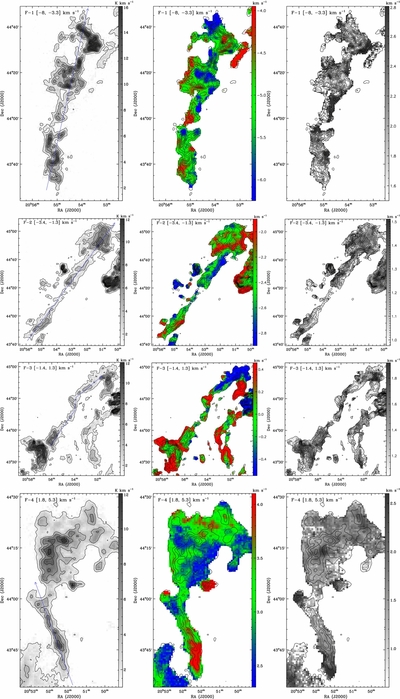
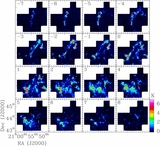
Caption: Figure 16.
13CO moment maps of the filaments showing the integrated intensity (left), rest velocity (middle), and line width (right). In each panel, the zeroth-moment contour lines are overlaid from 7σ with 10σ intervals. The name and the velocity range of each filament are marked in the top left corner in each panel.
Other Images in This Article


Show More
Copyright and Terms & Conditions
© 2014. The American Astronomical Society. All rights reserved.
Copyright ©
2025 Astronomy Image Explorer. All Rights Reserved.