Image Details
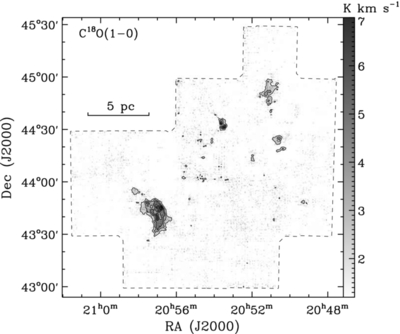
Caption: Figure 5.
Integrated intensity contours and grayscale map of C 18O. The spectra are integrated over −10 to 10 km s −1. The contours are from 2 K km s −1(~5σ) at intervals of 1.2 K km s −1, and the grayscale colors correspond to a linear stretch of integrated intensity.
Other Images in This Article


Show More
Copyright and Terms & Conditions
© 2014. The American Astronomical Society. All rights reserved.
Copyright ©
2025 Astronomy Image Explorer. All Rights Reserved.