Image Details

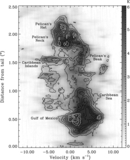
Caption: Figure 7.
Velocity-coded 13CO map. The color image shows the velocity distribution of the emission peak of 13CO. The black long arrow indicates the axis of the position–velocity map in Figure 8. The black dot on the axis indicates the position of the ionizing star. An azimuthally averaged (around the ionizing star within the sector region) position–velocity map is given in Figure 9. The positions of four filamentary structures are shown with white lines.
Other Images in This Article


Show More
Copyright and Terms & Conditions
© 2014. The American Astronomical Society. All rights reserved.
Copyright ©
2025 Astronomy Image Explorer. All Rights Reserved.