Image Details
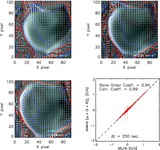
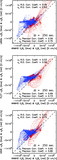
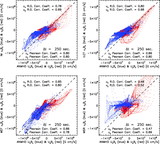
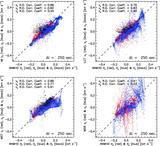
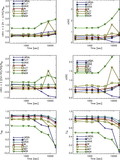
Caption: Fig. 13.
Pixel‐by‐pixel scatter plots comparing several methods’ (LMSAL’s LCT, FLCT, and DAVE; top to bottom) estimated normal Poynting flux with ANMHD’s, for ﹩\Delta t=250﹩ s. For each method, linear and rank‐order correlation coefficients are shown, as is the ratio of the integrated estimated Poynting flux to the integrated actual Poynting flux.
Other Images in This Article
Show More
Copyright and Terms & Conditions
© 2007. The American Astronomical Society. All rights reserved. Printed in U.S.A.
Copyright ©
2025 Astronomy Image Explorer. All Rights Reserved.