Image Details
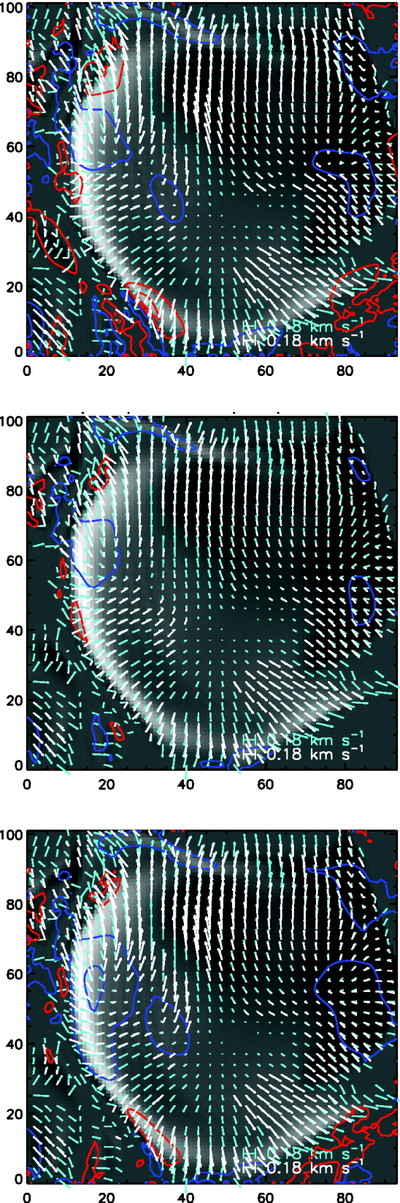
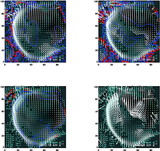
Caption: Fig. 4.
Estimated horizontal velocity vectors, ﹩\boldsymbol{v}_{\perp ,h}﹩ (white arrows) plotted over ANMHD’s horizontal velocity vectors at ﹩t=0﹩, ﹩\boldsymbol{V}_{\perp ,h}﹩ (aqua arrows) for LMSAL’s LCT, FLCT, and DAVE (top to bottom), for ﹩\Delta t=250﹩ s. Vectors are shown only for pixels in which ﹩\vert B_{z}\vert > 2.5\% ﹩ of ﹩\mathrm{max}\,( \vert B_{z}\vert ﹩), and for clarity, only every third vector was plotted. Gray scale shows ﹩B_{z}﹩. Blue (red) contours show smoothed upflows (downflows) corresponding to 0.12 and 0.04 km s−1 upward (downward). (The width of the smoothing window was 3 pixels.)
Other Images in This Article

Show More
Copyright and Terms & Conditions
© 2007. The American Astronomical Society. All rights reserved. Printed in U.S.A.