Image Details
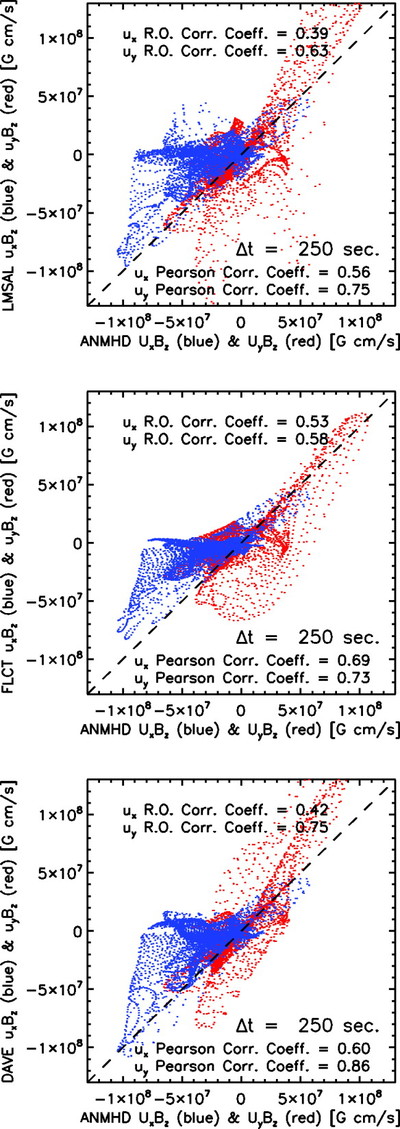
Caption: Fig. 2.
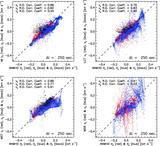
Pixel‐by‐pixel scatter plots of several methods’ (LMSAL’s LCT, FLCT, and DAVE; top to bottom) estimates of the flux transport rate, ﹩\boldsymbol{u}B_{z}﹩, defined in eq. (3), with ANMHD’s flux transport rate, ﹩\boldsymbol{U}B_{z}﹩, over the shortest time interval between data dumps, ﹩\Delta t=250﹩ s. Blue and red are used to distinguish x‐ and y‐components, respectively. For each method, nonparametric Spearman rank‐order correlation coefficients and linear (Pearson) correlation coefficients are shown for both components of the flux transport velocity.
Other Images in This Article

Show More
Copyright and Terms & Conditions
© 2007. The American Astronomical Society. All rights reserved. Printed in U.S.A.
Copyright ©
2025 Astronomy Image Explorer. All Rights Reserved.