Image Details
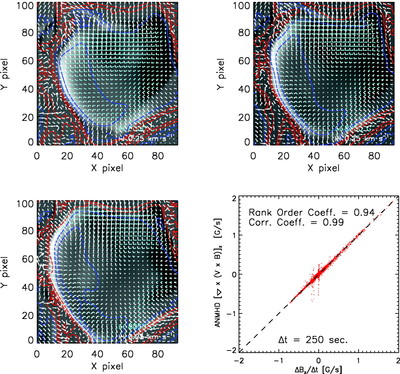
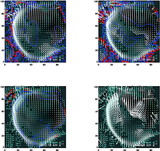
Caption: Fig. 1.
Three horizontal slices extracted from the ANMHD run, at −8361, 0, and 8385 s, are shown in the top left, top right, and bottom left panels. The pixel size is 348 km. The vertical magnetic field is shown in gray scale (﹩\mathrm{max}\,\left(\vert B_{z}\vert \right)=7.4﹩ kG), with the horizontal magnetic field in aqua. Smoothed vertical upflows (downflows) are shown with blue (red) contours, corresponding to 0.12 and 0.04 km s−1 upward (downward). (The width of the smoothing window was 3 pixels.) The horizontal velocity field is shown in white. Only components of ﹩\boldsymbol{V}_{\perp }﹩, the flow perpendicular to ﹩\boldsymbol{B}﹩, are shown. The perpendicular flows and fields shown in the top right panel are taken as the "true" perpendicular flow and average field in our comparisons. The bottom right panel shows that ANMHD’s field evolution obeys the induction equation over the interval ﹩\Delta t=250﹩ s, the shortest time step over which we estimated velocities. This ﹩\Delta t﹩ is 3 times larger than ANMHD’s time step dt. Legends in the top left, top right, and bottom left panels show lengths corresponding to 8000 G and 0.25 km s−1 for Bh and V⊥, respectively.
Other Images in This Article

Show More
Copyright and Terms & Conditions
© 2007. The American Astronomical Society. All rights reserved. Printed in U.S.A.