Image Details
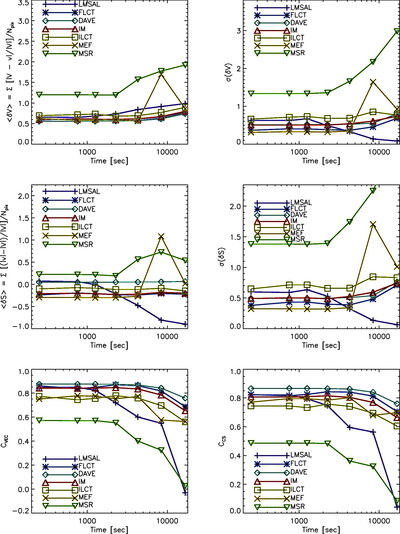
Caption: Fig. 8.
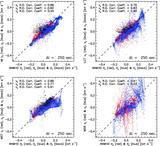
Each method’s average fractional vector error (eq. [13]; top left) and the square root of its variance (eq. [14]; top right) as ﹩\Delta t﹩ increases. Also shown are each method’s average fractional error in speed (eq. [15]; middle left) and the square root of its variance (eq. [16]; middle right) as ﹩\Delta t﹩ increases. We also plot each method’s vector correlation ﹩C_{\mathrm{vec}\,}﹩ (eq. [17]; bottom left) as ﹩\Delta t﹩ increases. Finally, we plot each method’s direction correlation ﹩C_{\mathrm{CS}\,}﹩ (eq. [18]; bottom right) as ﹩\Delta t﹩ increases.
Other Images in This Article

Show More
Copyright and Terms & Conditions
© 2007. The American Astronomical Society. All rights reserved. Printed in U.S.A.
Copyright ©
2025 Astronomy Image Explorer. All Rights Reserved.