Image Details
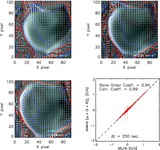
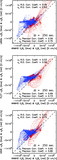
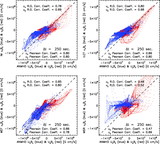
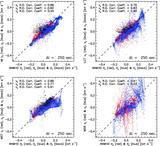
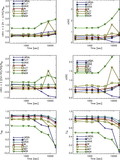
Caption: Fig. 11.
Pixel‐by‐pixel scatter plots comparing several methods’ (LMSAL’s LCT, FLCT, and DAVE; top to bottom) estimated electric field components with ANMHD’s, for ﹩\Delta t=250﹩ s. Black forward slashes, dark‐gray backslashes, and light‐gray vertical bars correspond to ﹩E_{x}﹩, ﹩E_{y}﹩, and ﹩E_{z}﹩, respectively. For each method, nonparametric Spearman rank‐order correlation coefficients are also shown for each component of ﹩\boldsymbol{E}﹩.
Other Images in This Article
Show More
Copyright and Terms & Conditions
© 2007. The American Astronomical Society. All rights reserved. Printed in U.S.A.
Copyright ©
2025 Astronomy Image Explorer. All Rights Reserved.