Image Details
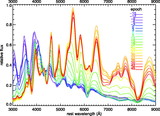
Caption: Fig. 8.
K‐correction errors to the ﹩B﹩ band where the template spectrum is color‐corrected with rest‐frame colors. The errors of the new template and the revised template of N02 are represented with solid black and dotted curves, respectively. The statistical errors are plotted in the left panel, and the systematic errors in the right panel. The thickness of the black solid curve shows the dispersion from the random selection process and the thin white curve is the mean. The errors presented here are for individual observations on a light curve.
Other Images in This Article
Show More
Copyright and Terms & Conditions
© 2007. The American Astronomical Society. All rights reserved. Printed in U.S.A.
Copyright ©
2026 Astronomy Image Explorer. All Rights Reserved.