Image Details
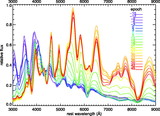
Caption: Fig. 3.
﹩K﹩‐corrections from observed ﹩i_{\mathrm{M}\,}﹩ band to rest‐frame B band as a function of broadband colors, ﹩U-B﹩ (left panels) and ﹩B-V﹩ (right panels). The ﹩K﹩‐correction‐color relations are plotted at the redshifts ﹩z=0.75﹩ (top panels) and ﹩z=0.9﹩ (bottom panels). The ﹩i_{\mathrm{M}\,}﹩ and B filter bands are aligned at ﹩z=0.75﹩ and misaligned at ﹩z=0.9﹩. All the library spectra with adequate wavelength coverage are included. Each point represents one library spectrum. Filled and open circles represent normal and peculiar SNe Ia, respectively. The diversity in colors mostly reflects the time evolution of supernova colors. The scatter reflects the differences in spectral features.
Other Images in This Article
Show More
Copyright and Terms & Conditions
© 2007. The American Astronomical Society. All rights reserved. Printed in U.S.A.