Image Details
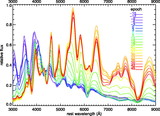
Caption: Fig. 4.
Example of color‐correction that contrasts the two color‐correction methods: reddening law slope correction and mangling function. The spectral template is color‐corrected to match the colors of an observed spectrum. The top panel shows three spectra: the observed spectrum (gray line), the spectral template corrected by the mangling function (black solid line), and the spectral template corrected by the reddening law (black dotted line). The bottom panel shows the color‐correction scale for the mangling function (black solid line) and for the reddening law (black dotted line). The black dots locate the spline knots for the mangling function. The mangling function adjusts the continuum using all the color information supplied, ﹩B-V﹩ and ﹩V-R﹩.
Other Images in This Article
Show More
Copyright and Terms & Conditions
© 2007. The American Astronomical Society. All rights reserved. Printed in U.S.A.