Image Details
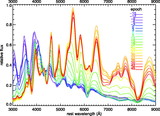
Caption: Fig. 2.
Characteristics of our current spectral library. The histograms are separated by redshift at ﹩z=0.2﹩ to demonstrate the difference in characteristics between the two samples (gray: ﹩z< 0.2﹩; black: ﹩z> 0.2﹩). The top left panel plots the histogram of the redshifts of the library supernovae. The top right panel plots the histogram of the stretch factors of the library supernovae. Only supernovae with reliable photometry are included in this plot. The median stretch value for the combined sample is marked with a dotted vertical line. The bottom left and right panels plot the histograms of the rest‐frame epoch relative to ﹩B﹩ band maximum light and the rest‐frame wavelength coverage of the library spectra, respectively.
Other Images in This Article
Show More
Copyright and Terms & Conditions
© 2007. The American Astronomical Society. All rights reserved. Printed in U.S.A.