Image Details
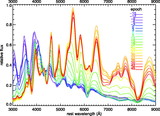
Caption: Fig. 10.
Location of the observed filters at redshifts ﹩z=0.36﹩ (top) and ﹩z=0.54﹩ (bottom). We consider the same example of ﹩K﹩‐correction as in Fig. 9. The solid curves represent the rest‐frame ﹩B﹩ band, while the dotted curves represent the observed ﹩g_{\mathrm{M}\,}﹩, ﹩r_{\mathrm{M}\,}﹩, and ﹩i_{\mathrm{M}\,}﹩ bands. At redshifts where the observed and rest‐frame filter bands are misaligned, the observed color that straddles the rest‐frame filter band (highlighted for each plot) is the most important.
Other Images in This Article
Show More
Copyright and Terms & Conditions
© 2007. The American Astronomical Society. All rights reserved. Printed in U.S.A.
Copyright ©
2026 Astronomy Image Explorer. All Rights Reserved.