Image Details
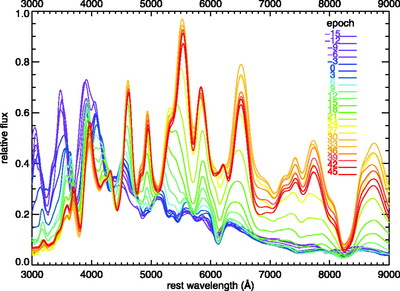
Caption: Fig. 5.
Illustration of the time evolution of spectral features of SNe Ia. A spectral template is plotted from ﹩t=-15﹩ to 48 relative to maximum ﹩B﹩‐band light. Template spectra at different epochs are normalized to the same ﹩B﹩‐band flux to emphasize the evolution of the spectral features. Spectral features of SNe Ia evolve rapidly around maximum light and slow down past ﹩t=30﹩. This emphasizes the importance of small epoch bins near maximum light.
Other Images in This Article
Show More
Copyright and Terms & Conditions
© 2007. The American Astronomical Society. All rights reserved. Printed in U.S.A.
Copyright ©
2026 Astronomy Image Explorer. All Rights Reserved.