Image Details
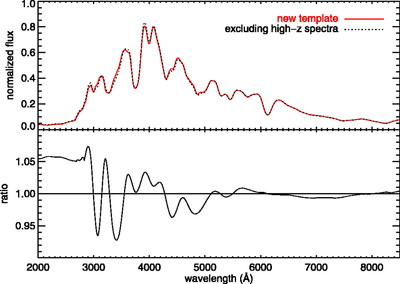
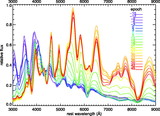
Caption: Fig. 13.
Comparison between the spectral template built with the full sample of library spectra (solid curve) and the spectral template built with only low‐redshift spectra (dotted curve). The templates at maximum light are shown. The difference in ﹩K﹩‐corrections between the two spectral templates is small and mostly reflects the difference in the wavelength coverage of the two samples, rather than true evolution.
Other Images in This Article
Show More
Copyright and Terms & Conditions
© 2007. The American Astronomical Society. All rights reserved. Printed in U.S.A.
Copyright ©
2026 Astronomy Image Explorer. All Rights Reserved.